工讀 · 甄選會Work-Study
Log 資料分析(ELK)Log Analytics (ELK)
以 Elastic Stack 分析甄選會 Log,建立可視化儀表板與查詢流程。Used the Elastic Stack to analyze admissions-committee logs with dashboards and query pipelines.
概述Overview
大學甄選入學委員會的系統每天會產生大量伺服器與應用程式 Log,這些散落的純文字紀錄裡其實藏著系統運作、流量尖峰與異常錯誤的線索,但人工翻找幾乎不可行。我於碩一工讀期間導入 ELK(Elastic Stack),把原始 Log 變成可搜尋、可視覺化的資料,讓團隊能快速掌握系統狀況、定位問題。The admissions-committee systems produce large volumes of server and application logs each day. These scattered plain-text records hold clues about system behavior, traffic peaks, and errors — but combing through them by hand is impractical. During my first-year M.S. work-study I introduced the ELK (Elastic Stack) to turn raw logs into searchable, visualized data, letting the team quickly understand system health and locate issues.
資料流程Pipeline
- Logstash 攝取與解析:收集各來源 Log,透過 grok 等過濾器將非結構化文字解析為結構化欄位(時間、來源、等級、訊息)。Logstash ingest & parse: collects logs from multiple sources and uses filters (e.g., grok) to turn unstructured text into structured fields (timestamp, source, level, message).
- Elasticsearch 索引:將解析後的事件建立索引,支援快速的全文檢索與聚合查詢。Elasticsearch index: indexes the parsed events for fast full-text search and aggregation queries.
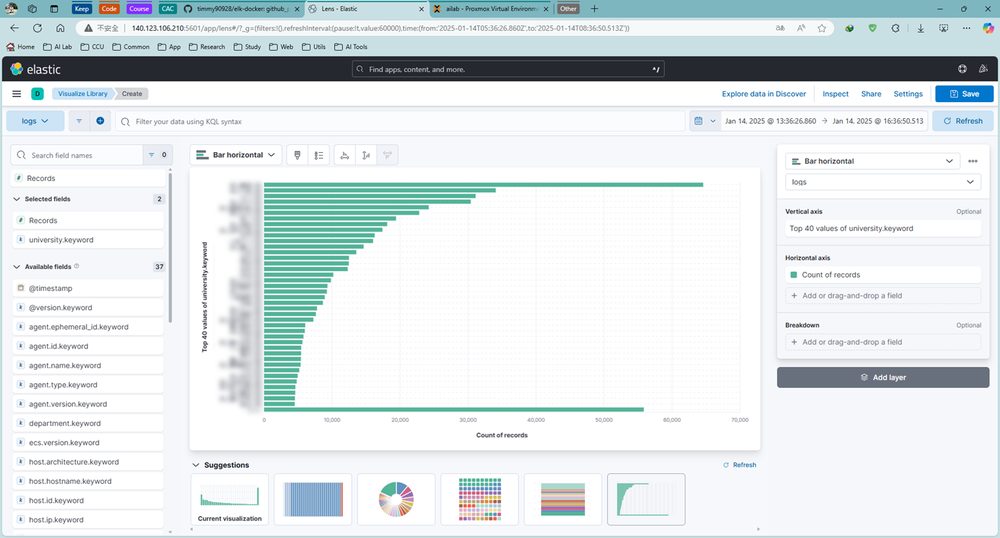
- Kibana 可視化:建立儀表板呈現流量趨勢、錯誤分佈與狀態指標,並提供互動式查詢。Kibana visualization: builds dashboards for traffic trends, error distribution, and status metrics, with interactive querying.
應用情境Use Cases
- 狀態監控:以儀表板即時掌握系統流量與運作狀況。Status monitoring: dashboards give a real-time view of traffic and system health.
- 問題定位:發生異常時,可依時間、來源與錯誤等級快速篩選與追蹤。Troubleshooting: when anomalies occur, filter and trace quickly by time, source, and error level.
- 趨勢分析:聚合長期資料,觀察尖峰時段與使用模式。Trend analysis: aggregate long-term data to observe peak periods and usage patterns.
我的角色與收穫Role & Takeaways
我於碩一工讀期間負責導入並設定整套 ELK 流程——撰寫 Logstash 過濾規則、規劃 Elasticsearch 索引,並在 Kibana 上建立查詢與儀表板,讓原本只能逐行翻找的純文字 Log 變成可即時搜尋與視覺化的資料。這是我第一次實際接觸資料工程與系統可觀測性(observability),也讓我體會到「先讓資料可被看見,問題才有辦法被解決」。During my first-year M.S. work-study I introduced and configured the full ELK pipeline — writing Logstash filters, planning Elasticsearch indices, and building Kibana queries and dashboards — turning plain-text logs that once had to be read line by line into searchable, visualized data. It was my first hands-on exposure to data engineering and system observability, and it taught me that making data visible is the first step to solving problems.